
📈 From Big Data to Smart Decisions: Turning Maritime Analytics into Action
- Davide Ramponi

- 31. Okt. 2025
- 5 Min. Lesezeit
My name is Davide Ramponi, I’m 21 years old and currently training as a shipping agent in Hamburg.On my blog, I take you with me on my journey into the exciting world of shipping. I share my knowledge, my experiences, and my progress on the way to becoming an expert in the field of Sale and Purchase – the trade with ships.

In today’s post, we’re unpacking one of the biggest questions in modern maritime operations:How can we turn the massive volumes of data collected from ships into meaningful, actionable business decisions?From engine sensors to fuel logs, GPS tracks to maintenance records, vessels today generate a flood of data — but data alone doesn’t make decisions. What matters is what you do with it.
The shipping industry has embraced the term “digital transformation,” but many companies still struggle with turning data into value — whether that’s in reducing fuel bills, predicting failures, or streamlining compliance.
🔍 In this post, I’ll walk you through:
🔑 How to turn ship data into actionable insights
⚠️ The common pitfalls in maritime data projects
📊 Tools that help visualize and drive smarter decisions
⚓ Use cases across operations, finance, and compliance
🧠 How to build a data-literate culture across your fleet
Let’s set course toward smarter shipping — powered by better decisions. 🚀
🔑 From Raw Data to Real Insight
Every ship is a floating data center — continuously collecting:
Engine output
Fuel consumption
Voyage performance
Weather conditions
Emissions and ballast records
Crew logs and maintenance reports
But collecting data isn’t the endgame. The challenge is extracting insights that drive outcomes.
How to Make Data Actionable:
📥 Aggregate It
Bring data from multiple sources (PMS, ECDIS, sensors) into a single system.
🧹 Clean It
Remove inconsistencies, standardize formats, and filter out noise.
🧠 Analyze It
Use tools to discover patterns, detect anomalies, and predict outcomes.
📈 Visualize It
Make it accessible through dashboards that everyone can understand — not just data scientists.
🏁 Act on It
Embed the findings into workflows: routing changes, maintenance schedules, fuel strategies.
🧠 Insight isn’t what the data tells you. It’s what you can do differently because of what the data tells you.
⚠️ Common Pitfalls in Maritime Data Projects
Not every data initiative leads to success. Here are the top five traps to avoid:
1️⃣ Data for Data’s Sake
Collecting data without clear goals leads to digital clutter. Every data point should serve a purpose — whether for performance, compliance, or cost control.
2️⃣ Siloed Systems
When data lives in isolated software tools or departments, you miss the bigger picture. Integration is key.
3️⃣ Lack of Standardization
Different ships, different crews, different formats = messy data. Without standardized input and consistent units, comparisons are meaningless.
4️⃣ Overcomplicated Dashboards
Data overload can paralyze users. The goal isn’t more data — it’s the right data, delivered clearly.
5️⃣ No Clear Ownership
If no one “owns” the data — cleaning it, interpreting it, and acting on it — then it falls between the cracks.
📉 A surprising number of maritime analytics projects fail because the insights never make it into operational decisions.
📊 Tools for Visualization and Smarter Decisions
Leading Maritime Data Platforms
Tool | Strengths | Use Cases |
DNV Veracity | Data cleaning + emissions tracking | EU MRV, fuel benchmarking |
OrbitMI | Dashboard-based decisions | Voyage planning, performance |
Kongsberg Vessel Insight | Sensor integration + analytics | Engine diagnostics, CII |
ABS My Digital Fleet | Condition-based monitoring | Predictive maintenance |
ZeroNorth | AI-optimized routing & carbon reduction | TCE optimization, decarbonization |
Visualization Best Practices:
📊 Use heat maps and trend lines for performance over time
🎯 Highlight outliers and anomalies visually
📅 Add filters by vessel, region, or voyage to make data navigable
🔴 Use color-coded alerts to prompt immediate action
💡 Visualizing data doesn’t just inform — it prompts action when designed for decision-makers, not just analysts.
⚓ Use Cases: Where Data Makes a Difference
🛠️ Operations
Fuel Optimization: Use data from noon reports and engine sensors to identify overconsumption and plan bunkering more efficiently.
Routing Decisions: Combine weather data, vessel performance, and fuel pricing to optimize ETA and minimize fuel spend.
Predictive Maintenance: Monitor vibration, temperature, and pressure trends to anticipate failures before they happen.
💰 Finance and Chartering
Voyage Cost Breakdown: Track fuel, port, weather delays, and compare against TCE to pinpoint profit leaks.
CII Score Forecasting: Predict how current operations will impact your annual rating — adjust speed or routing accordingly.
Performance-Based Contracts: Use verified analytics to negotiate charter clauses based on speed, emissions, or fuel use.
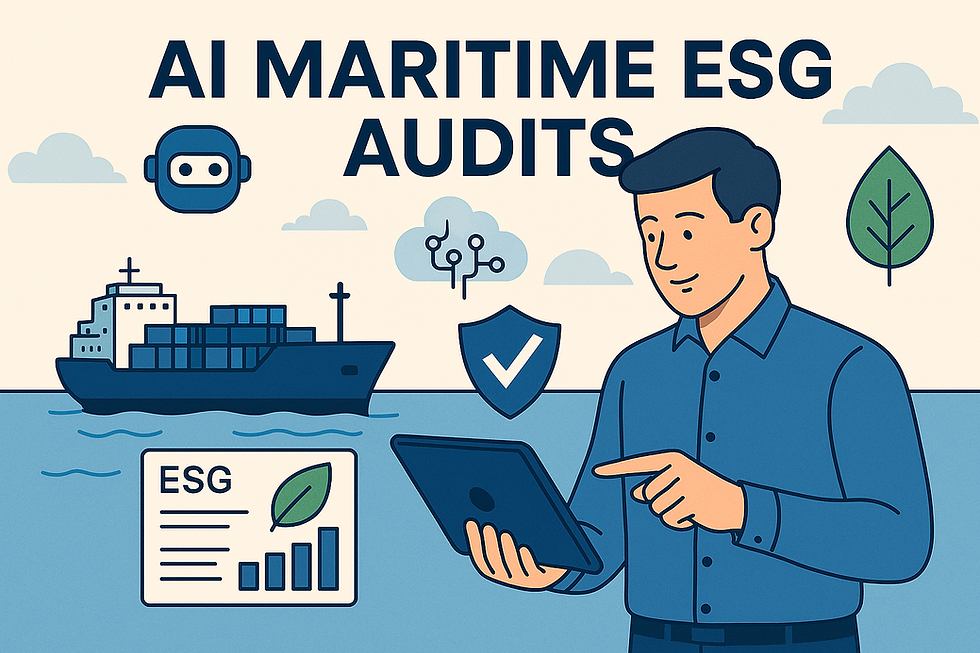
🧾 Compliance and ESG
MRV & DCS Reporting: Automate fuel and CO₂ data capture to reduce admin time and improve accuracy.
EU ETS Readiness: Track carbon tonnage by route and customer — prepare cost allocation models.
Social Data Tracking: Log crew welfare, rest hours, and safety training digitally to align with ESG goals.
📈 What gets measured gets managed. And what gets visualized gets prioritized.
🧠 Building a Data-Literate Maritime Organization
A smart analytics system is only as effective as the people using it. That’s why data literacy is becoming a core skill — not just for IT teams, but for captains, superintendents, and commercial managers.
How to Build a Data-Driven Culture:
1. 🧑🏫 Train Staff
Offer practical training on reading dashboards, interpreting metrics, and responding to alerts.
2. 📢 Communicate KPIs
Align the bridge, office, and boardroom with shared performance goals — like fuel targets or CII scores.
3. 🧑💻 Appoint Data Champions
Every team should have someone who “owns” the data — keeps it clean, relevant, and actionable.
4. 📈 Reward Data-Driven Behavior
Recognize crews or departments that improve metrics through insight-driven action.
🧭 Data can’t replace judgment — but it can improve it, align it, and speed it up.
🔮 What’s Next: Smarter, Leaner, and More Transparent
As AI, IoT, and cloud platforms mature, maritime analytics will become:
🤖 More Predictive
AI will forecast not only breakdowns, but voyage profitability, regulatory risks, and crew fatigue.
🌍 More Integrated
Data from port authorities, weather services, and regulatory bodies will merge into shared platforms for global visibility.
🔗 More Standardized
International data formats (e.g., S-211, ISO 19848) will help unify inputs across flag states, charterers, and class societies.
📡 More Real-Time
With satellite and IoT, ship data will stream continuously to shore — enabling real-time course corrections across operations.
🧭 Conclusion: Data Is Power — But Only When You Use It
Big data means nothing without smart decisions. Whether you're optimizing a route, forecasting emissions, or negotiating a charter, the key is turning data into clarity, confidence, and action.
Key Takeaways 🎯
💡 Data must be clean, visual, and timely to be useful
🚢 Use cases span ops, finance, and ESG — not just tech
⚠️ Watch for silos, overload, and lack of ownership
📊 Invest in platforms that translate data into action
🧠 Build a culture where everyone understands the data that drives their work
Shipping isn’t just getting digital. It’s getting smarter. Let’s make sure we’re all part of the intelligence.
💬 Share your thoughts in the comments — I look forward to the exchange!


Kommentare